Suvajit Bera

Data Analyst | Power BI Developer | AI Practitioner

About Me

Suvajit Bera

I'm a data professional with expertise in transforming complex datasets into actionable insights. My work focuses on creating interactive visualizations and data-driven stories that help organizations make informed decisions.

With experience in Power BI, SQL, and data modeling, I specialize in developing comprehensive reports that reveal hidden patterns and trends in data. This portfolio showcases my projects across various sectors.
My Projects

Project One Preview

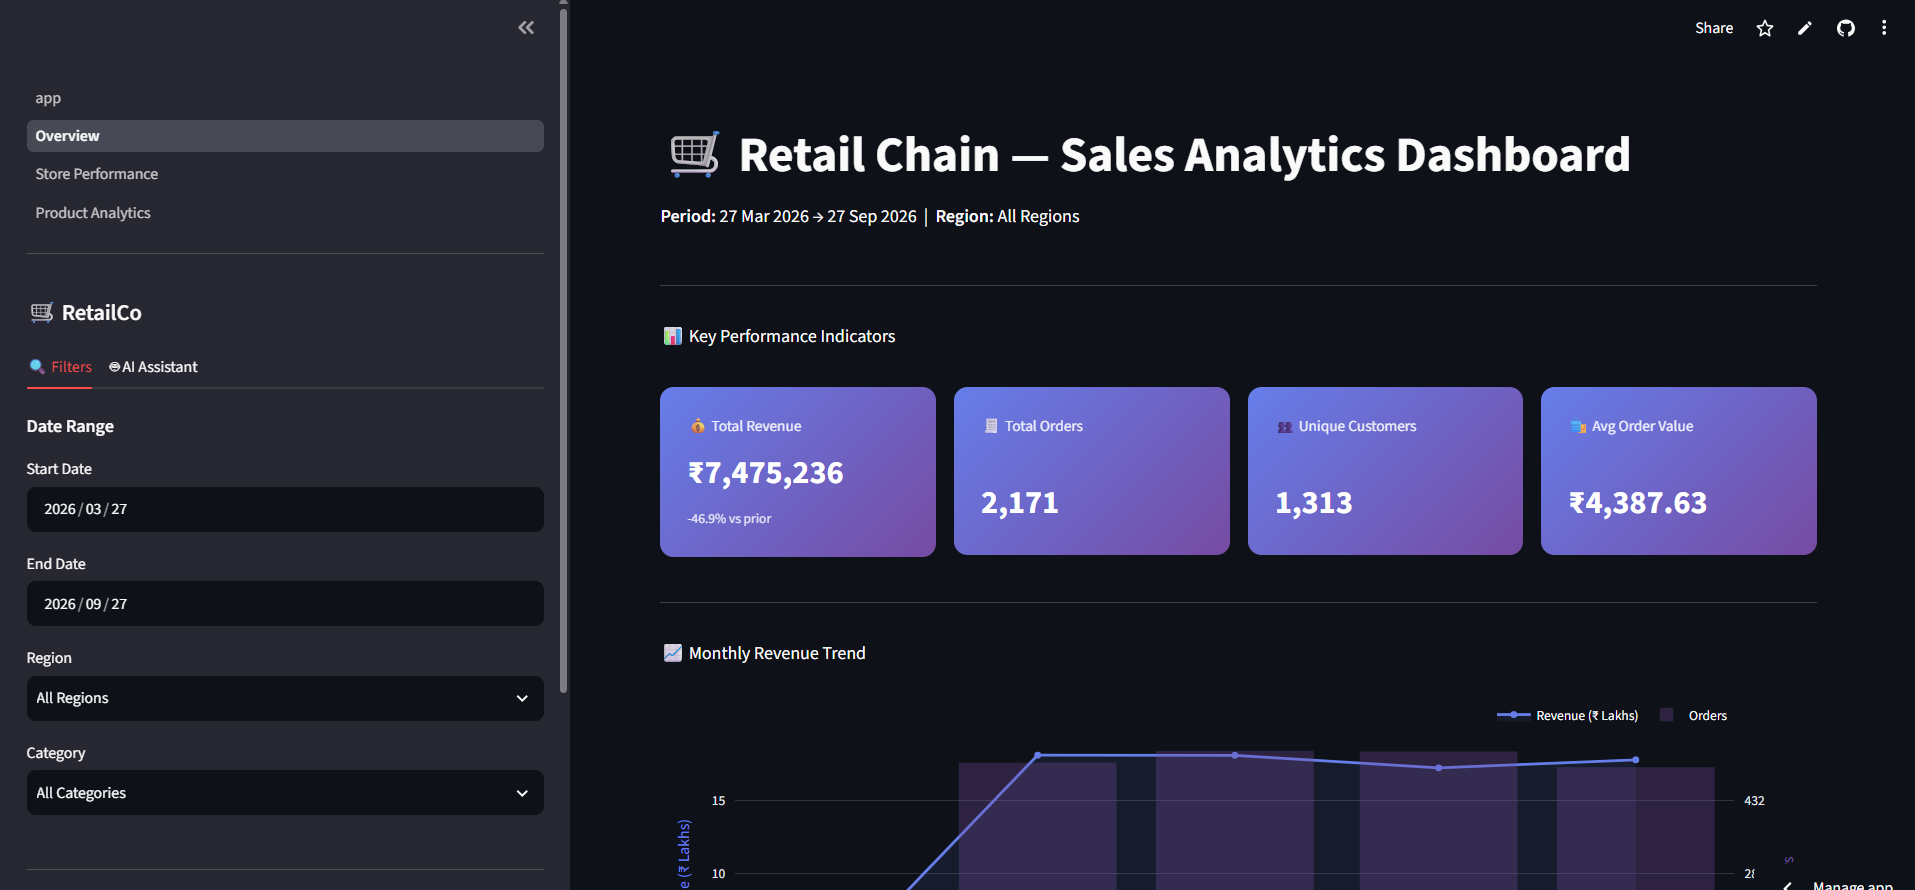
AI-Powered-Retail-Chain-Dashboard

A comprehensive full-stack data analytics platform for retail chain operations. Features AI-powered natural language queries, multi-page dashboards, and real-time profitability analysis across 14 stores, 40 products, and 2,000+ customers.

Project Two Preview

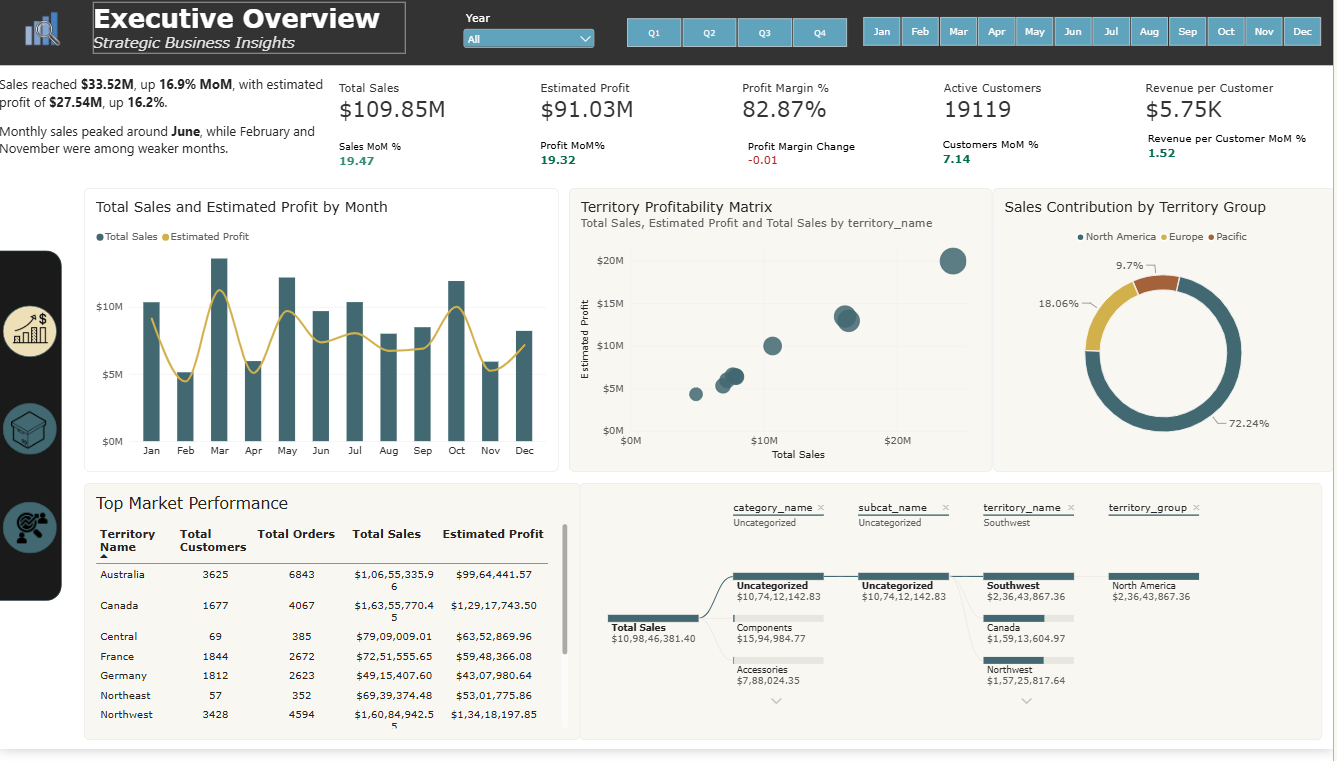
Enterprise-Retail-Lakehouse-Analytics

This project uses the AdventureWorks2022 OLTP sample database as its source. Eight source tables are exported as CSV, ingested into Databricks, transformed through Bronze, Silver and Gold layers, and modeled as a star schema for Power BI reporting.

Project Three Preview

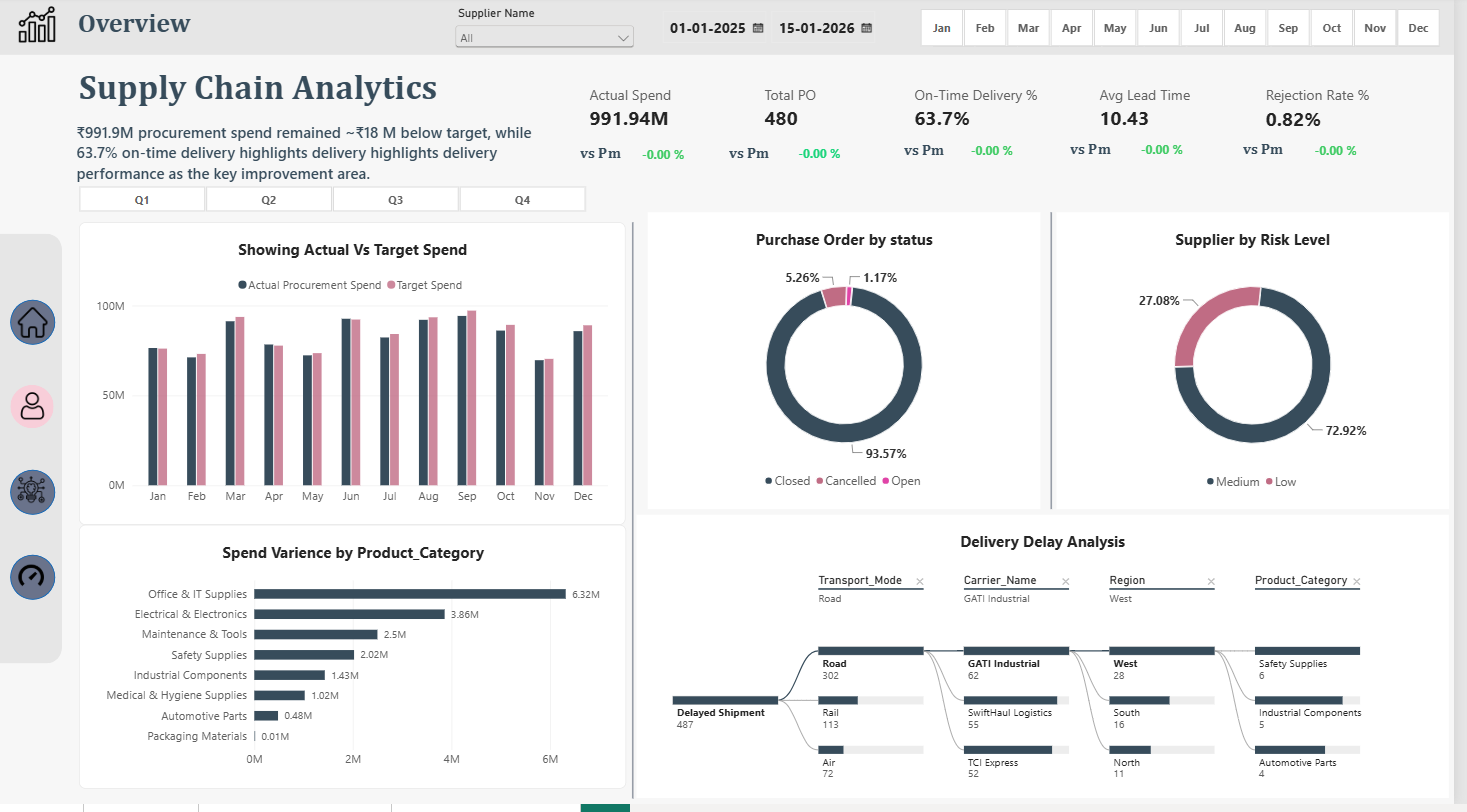
Supply Chain Analytics Dashboard | Power BI

This project is an interactive Supply Chain Analytics Dashboard built in Power BI to analyze procurement spend, supplier performance, purchase price variance, delivery efficiency, freight cost, and logistics performance.

Project Four Preview

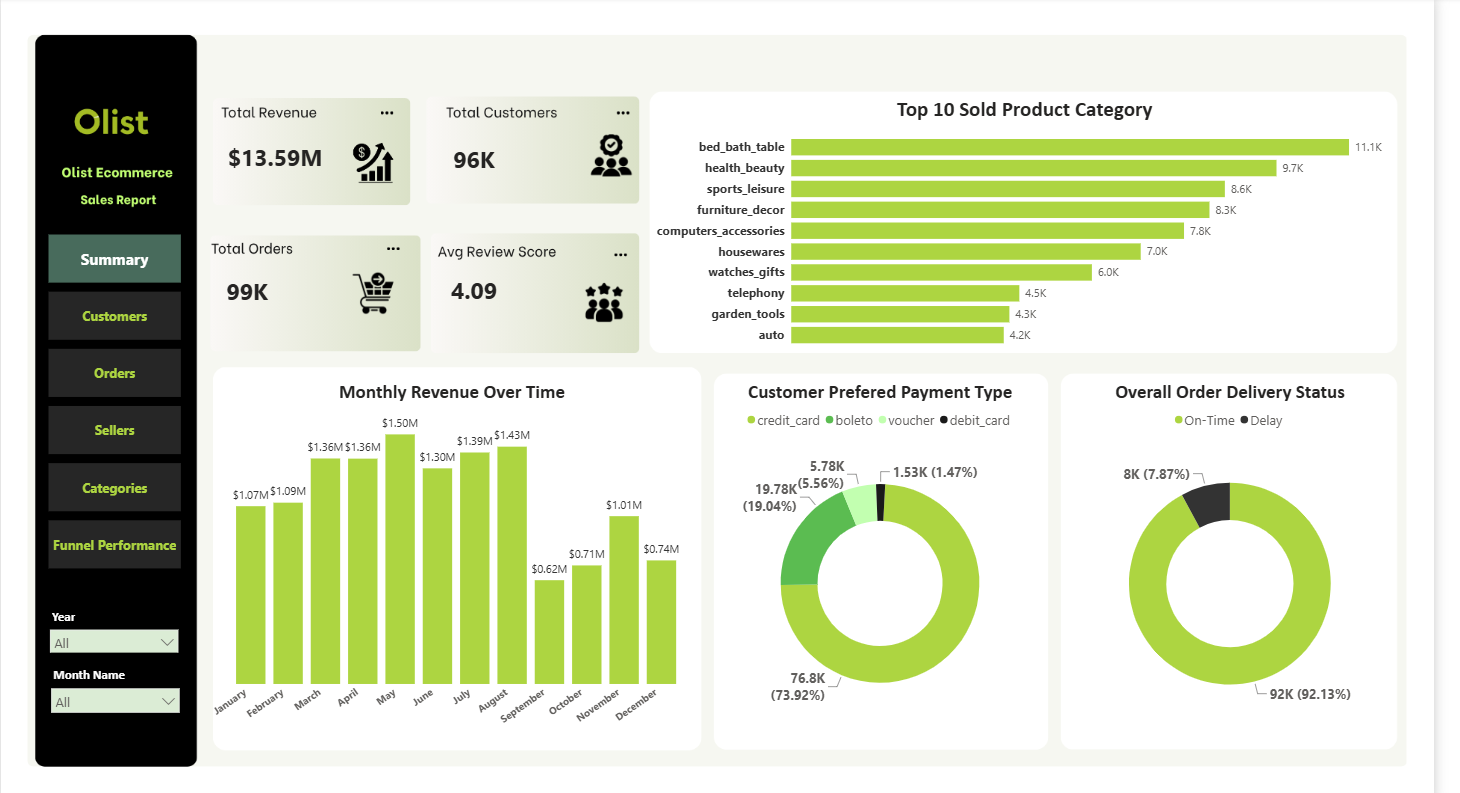
Olist Ecommerce End-To-End Data Analytics

An end-to-end analytics project built on the Olist Brazilian E-Commerce and Marketing Funnel datasets, covering the complete workflow from raw data ingestion -> analytical modeling -> SQL insights -> Power BI dashboards. This project demonstrates how real-world analytics teams design data models, validate data, derive insights, and communicate results through interactive dashboards.

Project Three Preview

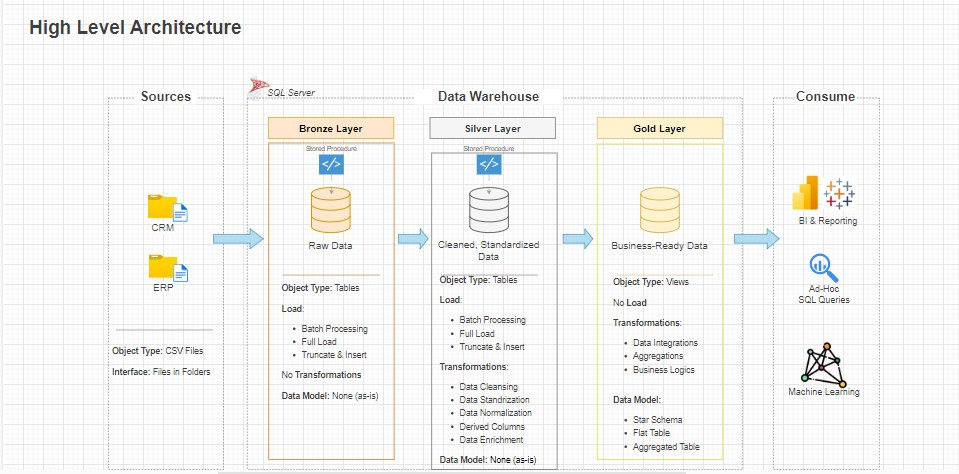
SQL Data Warehouse and Analytics

This Project demonstrates a comprehensive data warehousing and analytics solution, from building a data warehouse to generating actionable insights. Design as a portfolio Project, it highlights industry best practices in data engineering and analytics.

Project Three Preview

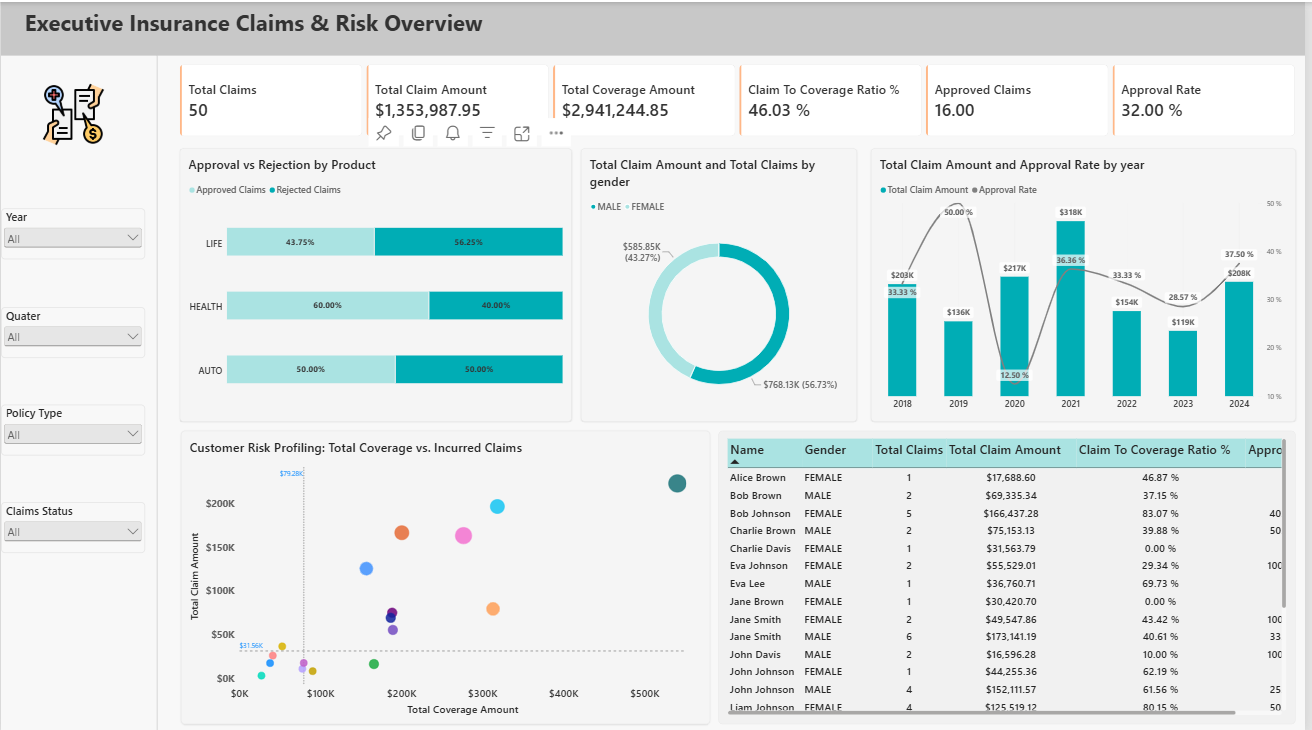
End-to-End Insurance Claims KPI & Risk Analytics (Microsoft Fabric)

An enterprise insurance lakehouse and Direct Lake analytics solution built using Microsoft Fabric, PySpark, Delta Lake, and Power BI. This platform ingests raw customer, policy, and claims transactions from Azure Blob Storage, processes data through a Medallion architecture, and exposes a Direct Lake semantic model for real-time customer risk profiling and claims underwriting performance.

Technical Skillset

Data Visualization

  • Power BI
  • Tableau
  • Looker Studio
  • Excel Dashboards
  • matplotlib, seaborn, Plotly

Data Analysis

  • SQL
  • Advanced Excel
  • Python (Pandas)
  • PySpark

Data Modeling & ETL

  • Power Query (M)
  • DAX
  • Star Schema Design
  • ETL Processes
  • Databricks(Delta Lake), Snowflake, Fabric

Send me a message

Interested in collaborating or have questions about my work? I'd love to hear from you!